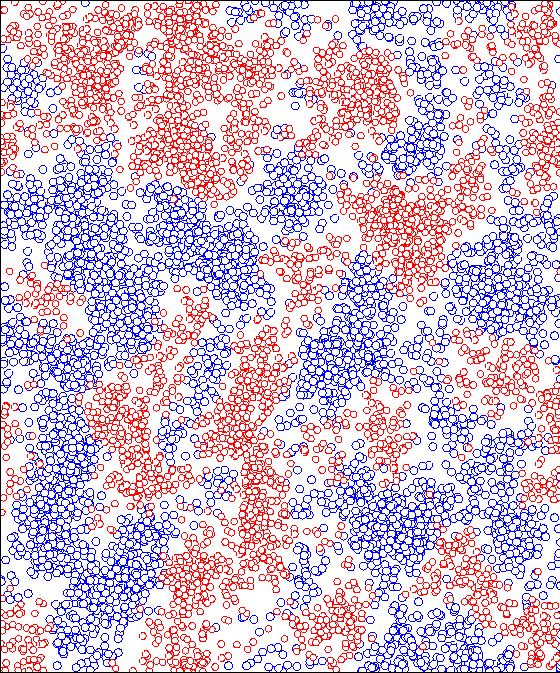
Here is a snapshot of a simulation of the diffusion-limited reaction
A+B--->0 in two dimensions. The two species are indicated by the different
colors. Note the existence of three length scales to describe the spatial
distribution of reactants: (a) the typical distance between individual
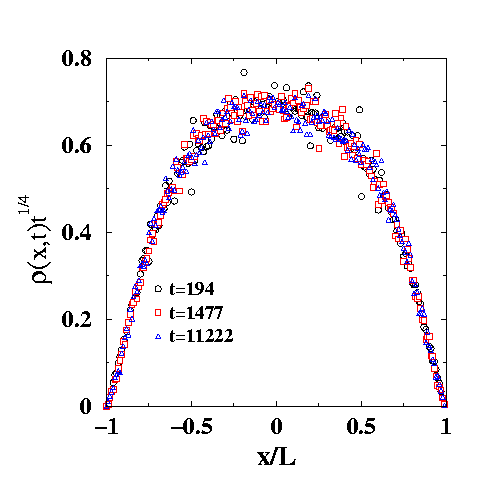
reactants, which grows with time as t1/4; (ii) the typical domain
size, which grows as t1/2; and (iii) the "gap" distance between
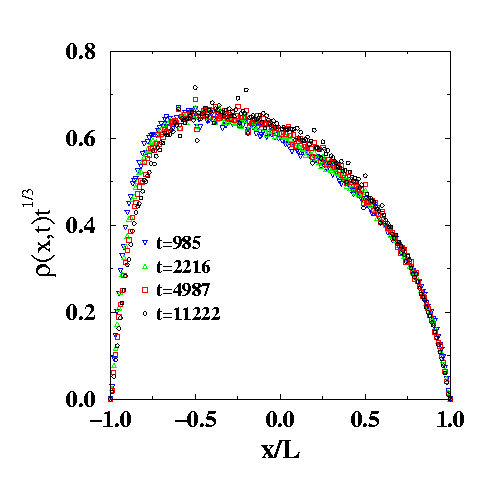
domains, which grows at t1/3. The latter is the white space
between domains and it is perhaps best visualized by squinting at the
picture.
For details, see ``Spatial
Organization in the Two-Species Annihilation Reaction A+B--->0'',
Phys. Rev. Lett. 66, 2168, (1991); ``Spatial Structure in Diffusion-Limited
Two-Species Annihilation'', Phys. Rev. A 46, 3132, (1992).


