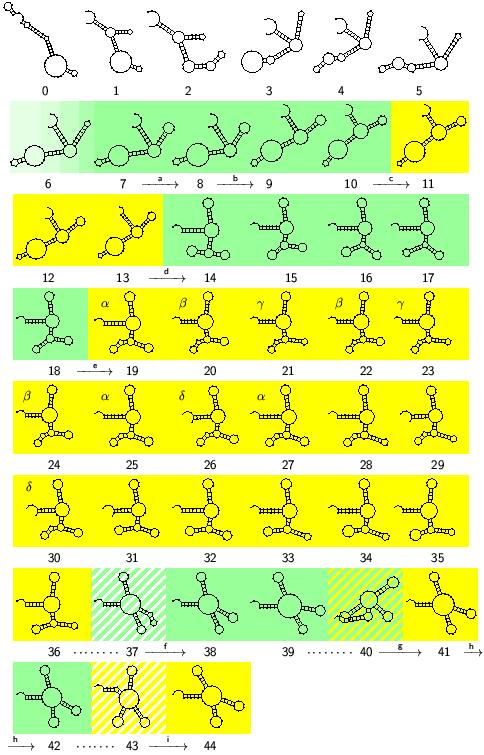
The figure shows the series of shapes on the evolutionary path of Figure 1A in our report. The initial (target) shape is labelled 0 (44). Continuous transitions are shape changes within the same color, discontinuous transitions cross color boundaries. Events marked in Figure 1A appear as labelled arrows. Shapes that were lost from the population and generated again along the trajectory are marked with greek letters.
on any arrow for a detailed discussion of the corresponding transition. on a shape to obtain its frequency at the time of the transition to the next shape.
A printable file of this figure is available for download [color postscript].