Ole Peters |
Home | Publications | Research | |

|
Economics
Convection Below is an introduction to the perspective on atmospheric convection I have been developing with my collaborators since 2002. | |||
|
Contents |
Convection in the atmosphere Remarks on phase transitions Event sizes in convection An atmospheric order parameter Bibliography |
Convection in the atmosphere Back to Contents
| 70% of Earth's surface is covered by water. Driven by solar radiation, surface water continually evaporates, rises in convective updrafts as vapor, eventually condenses and precipitates back to the surface, Fig.1. On average (over long times and large regions), evaporation and precipitation are in balance. Since this is the case, the total amount of water vapor in the atmosphere is roughly constant, that is, the system is in a statistically stationary state. Because the removal of instability by convection is much faster than the processes generating the instability, the system is usually close to a threshold where convection begins. This is the essential idea behind the seminal work by Arakawa and Schubert, published in 1974 [Arakawa Schubert 1974]. | |
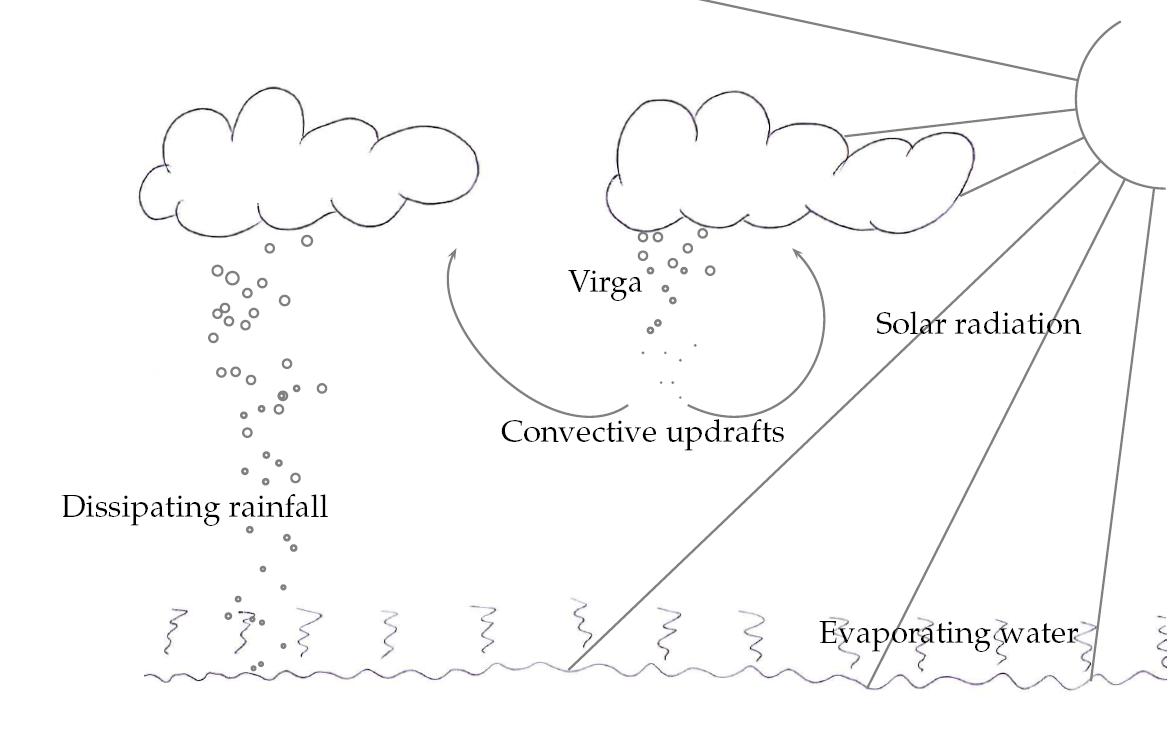 |
Figure 1 A cartoon of the water budget. |
|
Today this so-called "Quasi-Equilibrium" (QE) is part of the
representation of convection in many climate models. The part we are
most interested in is the nature of the "threshold". A threshold means
that something suddenly switches on, or changes behavior. In climate
models, this is often represented as a Heaviside or ramp
function[Betts Miller
1986, Neelin Zeng 2000], but no further
details of the transition are considered. It is recognized that
locally or on short time scales, the atmosphere can deviate from its
moist QE state. Typically, it is assumed that the system returns to
stationarity over some characteristic convective time scale.
The word "Quasi-Equilibrium" only means stationarity. It does not imply that the system is close to thermodynamic equilibrium. Although equilibrium concepts such as pressure and temperature are commonly used in atmospheric physics, in terms of the processes we consider, the system is constantly driven, and hence "far from equilibrium" in the parlance of statistical mechanics. A number of complex dynamical processes are involved in the constant rebalancing of the moisture budget in the atmosphere. For example, the process leading from condensation to precipitation is anything but simple, involving nucleation around aerosols, droplet growth and coalescence, often intermediate freezing and so on, a nice overview is the book by Rogers and Yau [Rogers Yau 1989]. The onset of convection is another problem. The atmosphere is cold on top and warm near the surface, which creates an instability. Moisture can add to the instability by allowing warm rising vapor to condense, release its latent heat and enhance updrafts. But whether convective available potential engergy (CAPE) can be released depends on the entire vertical profiles of (mostly) water vapor and temperature. The need for a simple parametrization of these processes for use in climate models therefore poses a hard problem, sometimes refered to as the "cumulus parametrization problem", [Arakawa 2006]. Remarks on phase transitions Back to Contents Considering that we're dealing with a slowly driven highly susceptible system that can store energy (in the form of water vapor) and suddenly release it (as rain showers), we might suspect that a good mathematical model of the system would have elements of self-organized criticality (SOC). By SOC we mean here the process of a spontaneous or automatic approach to the critical point of a continuous phase transition, as described by Tang and Bak [1988], and later put in the context of absorbing-state phase transitions by Dickman and co-workers[1998]. A few words about phase transitions are in order. What is a phase transition, and why should it have to be continuous? In a broad sense, a phase transition describes the change of macroscopic behavior of a system -- examples are the freezing of water, where a pond we might swim in suddenly turns into a pond we might ice-skate on. Such transitions are the result of local interactions (the water molecules start forming small crystals), nonetheless the effect is not local but system-wide (a crystal lattice spanning the whole pond is created). On a more specific level, phase transitions occur between phases of matter. Because the definition of a phase requires a thermodynamic potential (a free energy), and these potentials are really only well-defined in equilibrium, phase transitions are typically studied in equilibrium systems. So we'll start with that, and then see if we can use some of the ideas in non-equilibrium situations. In equilibrium, if the free energy is known as a function of the interaction parameters between the degrees of freedom we will define phases as regions in phase space where the free energy is analytic (i.e. where all of its derivatives with respect to the interaction parameters are finite). These regions are separated from each other by phase boundaries along which the free energy is non-analytic. Now comes the interesting bit. The non-analyticity along the phase boundary can mean that there is a jump, i.e. a discontinuity, in a first derivative of the free energy. In this case the transition is called "first-order". The other possibility is that higher-order derivatives either have a jump or diverge. These transitions are called "continuous". Continuous transitions are especially interesting if there's a divergence in a second (or higher) derivative. A divergence is interesting because it implies the divergence of physical quantities (that immediately implies that phase transitions strictly only exist in infinite systems, but that's another problem). These divergences require long-range correlation and are associated with "critical phenomena". This is also the name of the branch of statistical mechanics that deals with these effects. Again, "Critical Phenomena" is concerned with the the effects of divergences of derivatives of the free energy. An example is finite-size scaling: if a system is at a point in phase space where (in principle) something diverges, then this divergence is captured with increasing accuracy the bigger the system is. First-order phase transitions typically have a cusp in a higher derivative. While the cusps will be rounded off by finite-size effects and inaccuracies in the measurements, their height can be fully captured. These comments will become clearer in the application below. I recommend Julia Yeomans' book [1992], in particular Ch.2 for a discussion of first-order versus continuous phase transitions. Nigel Goldenfeld's book [1992] discusses many fundamental concepts in phase transitions in depth. The lesson we can carry over to non-equilibrium situations is that the vicinity of kinks in macroscopic observables is interesting. The kink can be the result of an underlying divergence (for example of a correlation length), and corresponding critical phenomena may be associated with it. This basic idea, that methods from critical phenomena may be used wherever kinks, scale-invariance and diverging scales are present is not new. Kenneth Wilson, in his acceptance speech for the Nobel-Prize in Physics in 1982, mentioned atmospheric physics as a potential beneficiary of the techniques he co-developed to address problems involving large ranges of scales [Wilson 1983]. Event sizes in the atmosphere Back to Contents If SOC has something to do with rain events, one first idea would be to look at distributions of the sizes of rain events, similar to avalanches in "sandpile" models. Since 1994 several research teams have taken this route [Vattay Harnos 1994 Andrade Schellnhuber Claussen 1998], and indeed, on short enough time scales with sufficient resolution one observes scale-free rain-event distributions [Peters Hertlein Christensen 2002], Fig.2.
|
Figure 2 | The event size distribution for rainfall. The straight line on the double-logarithmic plot indicates a power law. While this is interesting in its own right, both
from an SOC perspective and from a climatology perspective we can
learn much more by looking not only at "avalanches", which are akin to
critical clusters, but also at the more commonly used observables in
critical phenomena. These are in particular the order parameter and
its variance as a function of an appropriate tuning parameter. Soon
after we published Fig.2, it was pointed out that similar
statistics can be obtained from a model where rain is
transported by vortices and occasionally passes over a measurement
apparatus [Dickman 2003]. Clearly, an
apparent power-law distribution of an avalanche-like observable alone
does not mean that a self-organized critical model is terribly useful.
Fig.2 essentially ignores the spatial properties of rainfall (it's
derived from point-measurements). In 2009 we published a study on the
spatial properties of patches of
rain [Peters Neelin Nesbitt
2009].
| An atmospheric order parameter Back to Contents Of course, we cannot tune the atmosphere, but we can patiently wait for it to fluctuate into a region of phase space that we are interested in. We used 5 years of global satellite data, containing an estimated rain rate and a measure of atmospheric water vapor in microwave snapshots on a spatial grid with 20km linear resolution. We focused on large climatologically coherent ocean basins and computed the average rain rate conditioned on a given value of the water vapor. The rain rate seems a reasonable candidate for an order parameter, reducing the energy in the atmosphere in much the same way as the activity in a sandpile model reduces the particle density. The water vapor is a measure of energy in the atmosphere and appears to control a continuous phase transition between quiescence (dry conditions) and activity (precipitation) [Peters Neelin 2006], see Fig.3. | 
Figure 3 | The order parameter and its variance versus the tuning parameter for the atmospheric system (different colors represent different regions on the globe). At the critical point (about 67mm) the order parameter picks up, and its fluctuations diverge. The inset shows the order parameter from different regions on log-log scales vs. the reduced tuning parameter. Apart from an opportunity to test and possibly extend Arakawa and Schubert's Quasi-Equilibrium hypothesis, this study also presents a unique opportunity to query a real-world system that seems to be well described by the (theoretical) concept of SOC. Unlike, for example, seismic systems the atmosphere is very accessible. Planes can fly through it, satellites can take pictures, and remote sensing equipment is readily available. In Fig.4 we confirm that the atmosphere is indeed attracted to the critical region where convection is initiated and precipitation starts. | 
Figure 4 | The frequency with which the system was observed at a given water vapour. The blue curve shows the same but conditioned on a non-zero rain rate. The red curve shows the order-parameter for orientation.
| Figure 5 shows that the analogy with continuous phase transitions holds even further. Measuring the variance of spatially averaged precipitation, we notice an anomalously slow decay with increasing averaging area when the system is close to criticality. This is equivalent to power-law decaying correlations on scales up to at least 200km.
| 
Figure 5 |
The variance of the order parameter, rescaled with the data resolution L raised to the non-trivial exponent 0.46. Different colors (main graph) are different rescaled resolutions. The inset shows that trivial re-scaling (with L*L) works well far away from criticality.
| Since the publication of our results in 2006, we have confirmed these properties in a data set from a satellite-borne precipitation radar (TRMM-PR)[Peters Neelin Nesbitt 2009]. We have also improved on the original results by including tropospheric temperature in the data analysis. This has the effect of removing a source of otherwise uncontrolled fluctuations [Neelin Peters Hales 2009]. Bibliography Back to Contents | ||||||
|
Seminal work on cumulus parametrization |
Arakawa, A. and W. H. Schubert, Interaction of a cumulus cloud ensemble with the large-scale environment, Part I. J. Atmos. Sci. 31, 674-701 (1974). | |||
|
Arakawa on our work in relation to cumulus parametrization |
Arakawa, A. Scaling tropical rain. Nature Phys. 2, 373-374(2006). doi: 10.1038/nphys323 | |||
|
First link between SOC and rainfall |
Andrade, R. F. S., H. J. Schellnhuber, and M. Claussen Analysis of rainfall records: possible relation to self-organized criticality. Physica A 254, 557-568 (1998). doi: 10.1016/50378-4371(98)00057-0 | |||
|
An early simple stochastic convection scheme |
Betts, A. K. A new convective adjustment scheme. Part I: Observational and theoretical basis Quart. J. Roy. Met. Soc. 112, 473, 677--691(1986). doi: 10.1002/qj.49711247307 Betts, A. K. and M. J. Miller A new convective adjustment scheme. Part II: Single column tests using GATE wave, BOMEX, ATEX and arctive air-mass data sets Quart. J. Roy. Met. Soc. 112, 473, 693--709(1986). doi: 10.1002/qj.49711247308 | |||
|
SOC and absorbing states |
Dickman, R., A. Vespignani, and S. Zapperi Self-organized criticality as an absorbing-state phase transition Phys. Rev. E 57, 5095-5105 (1998) | |||
|
A simple process to generate broad event size distributions |
Dickman, R. Rain, power laws, and advection. Phys. Rev. Lett. 90, 108701 (2003) | |||
|
Notes on fundamental concepts and techniques in critical phenomena
|
Goldenfeld, N. Lectures on phase transitions and the renormalization group. Oxford University Press (1992). | |||
| A meteorology-perspective on SOC in the tropics (supervised by Bob Plant). |
Jordan, T. Does self-organized criticality occur in the tropical convective system? Masters Thesis University of Reading (2008). | |||
|
Musings on applications in climate models |
Neelin, D., O. Peters, J. Lin, K. Hales, and C. Holloway Rethinking convective quasi-equilibrium observational constraints for stochastic convective schemes in climate models. Phil. Trans. Roy. Soc. 366, 2581-2604 (2008). doi: 10.1098/rsta.2008.0056 | |||
|
The convection transition including temperature |
Neelin, D., O. Peters and K. Hales The Transition to Strong Convection. J. Atmos. Sci. 66, 8, 2367-2384 (2009). doi: 10.1175/2009JAS2962.1 | |||
|
Strong evidence for scale-free rain events |
Peters, O., C. Hertlein, and K. Christensen, A complexity view of rainfall. Phys. Rev. Lett. 88, 018701-1 (2002). doi: 10.1103/PhysRevLett.88.018701 | |||
|
|
Peters, O., and K. Christensen, Rain: Relaxations in the Sky. Physical Review E 66, 036120-1 (2002). doi: 10.1103/PhysRevE.66.036120 | |||
|
Evidence for a continuous phase transition in precipitation |
Peters, O., and D. Neelin, Critical Phenomena in Atmospheric Precipitation. Nature Phys. 2, 393-396 (2006). doi: 0.1038/Nphys314 cond-mat/0606076 | |||
|
Some geometric properties of rain fields |
Peters, O., D. Neelin and S. Nesbitt Mesoscale Convective Systems and Critical Clusters. Accepted for publication in J. Atmos. Sci. (2009). doi: 10.1175/2008JAS2761.1 | |||
|
A nice book on cloud physics |
Rogers, R. R., and M. K. Yau, A short course in Cloud Physics. Butterworth-Heinemann 3rd edition (1989). | |||
|
SOC as a self-tuned continous phase transition |
Tang, C., and P. Bak Mean field theory of self-organized critical phenomena. J. Stat. Phys. 51, 5/6, 797-802 (1988). doi: 10.1007/BF01014884 | |||
|
First mention of SOC in atmospheric observables |
Vattay, G., and A. Harnos, Scaling behavior in daily air humidity fluctuations. Phys. Rev. Lett. 73, 768-771 (1994). doi: 10.1103/PhysRevLett.73.768 | |||
|
Critical phenomena and atmospheric dynamics in a Nobel lecture |
Wilson, K. The renormalization group and critical phenomena. Rev. Mod. Phys. 55, 583-600 (1983). doi: 10.1103/RevModPhys.55.583 | |||
|
Great introduction to critical phenomena |
Yeomans, J. Statistical mechanics of phase transitions. Oxford University Press (1992). | |||
|
|
||||